Sentinel-2 outperformed Landsat 8 in forest variable estimation
In a recent paper, published in Remote Sensing of Environment we compared the performance of Sentinel-2 and Landsat 8 satellites in the estimation of forest variables in Finland. The variables were stem volume (V), stem diameter (D), tree height (H) and basal area (G), and their species-wise components for pine (Pine), spruce (Spr) and broadleaved (BL) trees. We compared the S2 and L8 performances using twelve different test setups including different Sentinel-2 and Landsat 8 band combinations and pixel resolutions, and using two different modelling methods. They also identified the best predictive image bands for each test setup.
We used 739 circular field plots collected by the Finnish Forest Centre for the test setup comparison. The test setup with all Sentinel-2 bands resulted in best average performance over 100 modelling iterations. The plot-level relative root mean square errors (RMSE%) of the field observed mean were 38.4 % for average stem diameter, 42.5 % for stem basal area/ha, 30.4 % for average tree height, and 59.3 % for growing stock volume/ha with variables including all tree species. The corresponding best figures with all Landsat 8 bands were RMSE% = 44.6 %, 50.2 %, 36.6 % and 72.2 %, respectively. The Sentinel-2 outperformed Landsat 8 also when using near-equivalent image bands and Sentinel-2 data down-sampled to 30 m pixel resolution. The relative systematic error (bias%) did not show any significant differences between Sentinel-2 and Landsat 8 data. The best predictive Sentinel-2 image band was the red-edge 1 (B05_RE1), when estimating variable totals including all species. The median number of predictors in the best performing models was 4 – 6 for the Sentinel-2 and 4 – 5 for the Landsat 8 models, respectively.
We concluded to recommend Sentinel-2 Multispectral Instrument (MSI) data as the principal Earth observation data source in forest resources assessment.
Heikki Astola
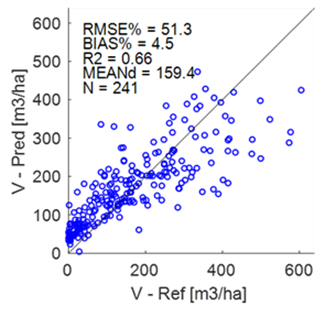
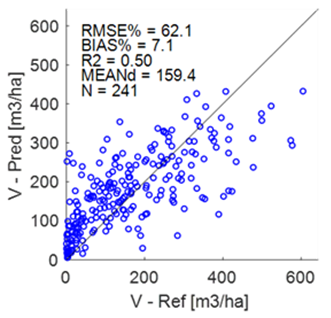
Test data set scatterplots of total stem volume (V) predictions for Sentinel-2 (left) and Landsat 8 (right) example model using all satellite bands. V-Ref = field reference data, V-Pred = prediction.
Reference:
Astola, H., Häme, T., Sirro, L., Molinier, M., Kilpi, J., ‘Comparison of Sentinel-2 and Landsat 8 imagery for forest variable prediction in boreal region’, Remote Sensing of Environment, Volume 223, 15 March 2019, Pages 257-273