Analyzing the Gran Canaria fire (17-24 August 2019) in Forestry TEP
It is all about fire these days! Just three weeks ago we showed some images of the Siberian wildfires in our blog, and since then the Amazon fires have been high on the agenda of all news agencies. In the meanwhile, Gran Canaria Island in the Atlantic Ocean near the coast of Northwest Africa experienced one of its most disastrous fires in recent years. The fire started on the 17th August and raged on around a week, burning over 10 000 ha of shrubland and forest, including large parts of the Tamadaba national park. Over 9000 people from more than 50 towns and villages were evacuated to safety.
The Sentinel-2 satellites recorded the progress of fire exceptionally well due to cloud free conditions on the area. The feature image above is an animated gif illustrating the progress of the fire. The first view shows the pre-fire situation (14th Aug 2019). An older burn scar can be seen in the middle. The second view (19th Aug 2019) shows ongoing fires, with active fire fronts visible in bright red lines in the false colour image (RGB: short wave infrared (2.1 µm), near infrared and red). And the final view of the time series (24th Aug 2019) presents the post-fire situation with the large burn scar clearly visible.
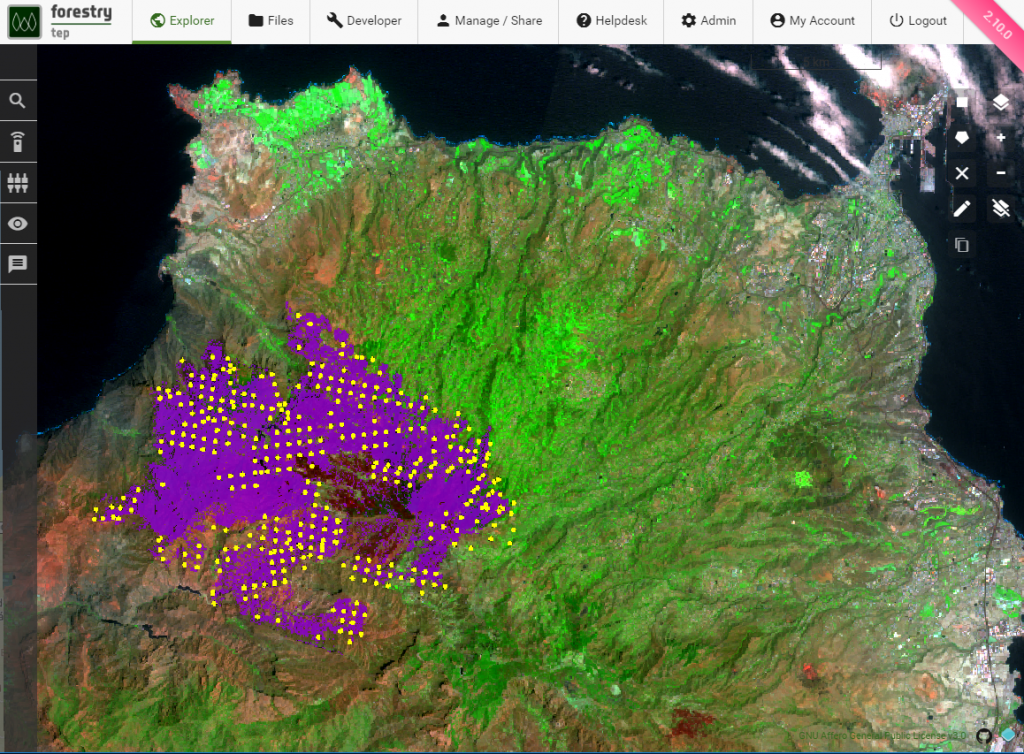
The two images below provide examples of the kind of operations that can be run in Forestry TEP to analyse fire images. The first image shows the burnt area of the fire, detected using the Autochange software developed by VTT and implemented in Forestry TEP. The burnt area is visible in purple colour. VIIRS active fire detections from 14-24th August are also overlaid on the image. Note that the active fire detection has missed some portions of the fire entirely. This may be caused for example by fast progressing fire (missed by satellite overpasses) or thick smoke/clouds blocking active fires in some days.
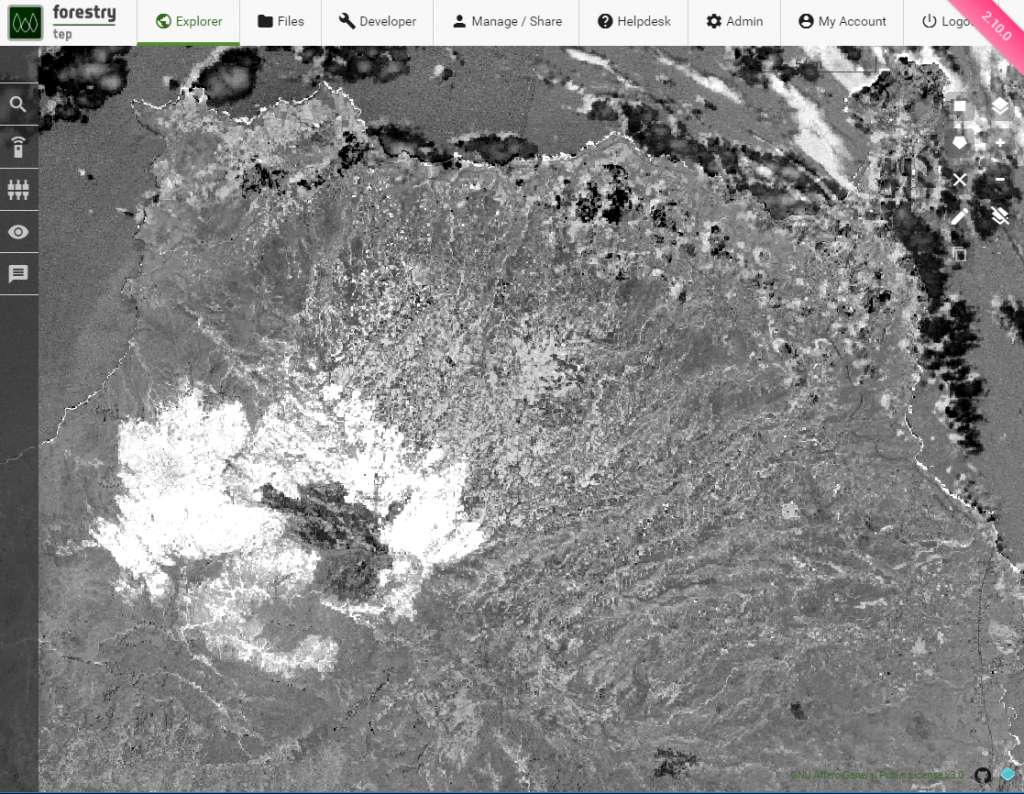
The last image below shows the change of Normalized Burn Ratio (dNBR) values from 14 to 24 August. The burnt areas stand out as bright white areas, due to high values of NBR change. The change image has been produced using the online QGIS application service available in Forestry TEP.